
Six use cases, among many possible
From a single street to the entire network: ready-made analyses, and others built around your needs.
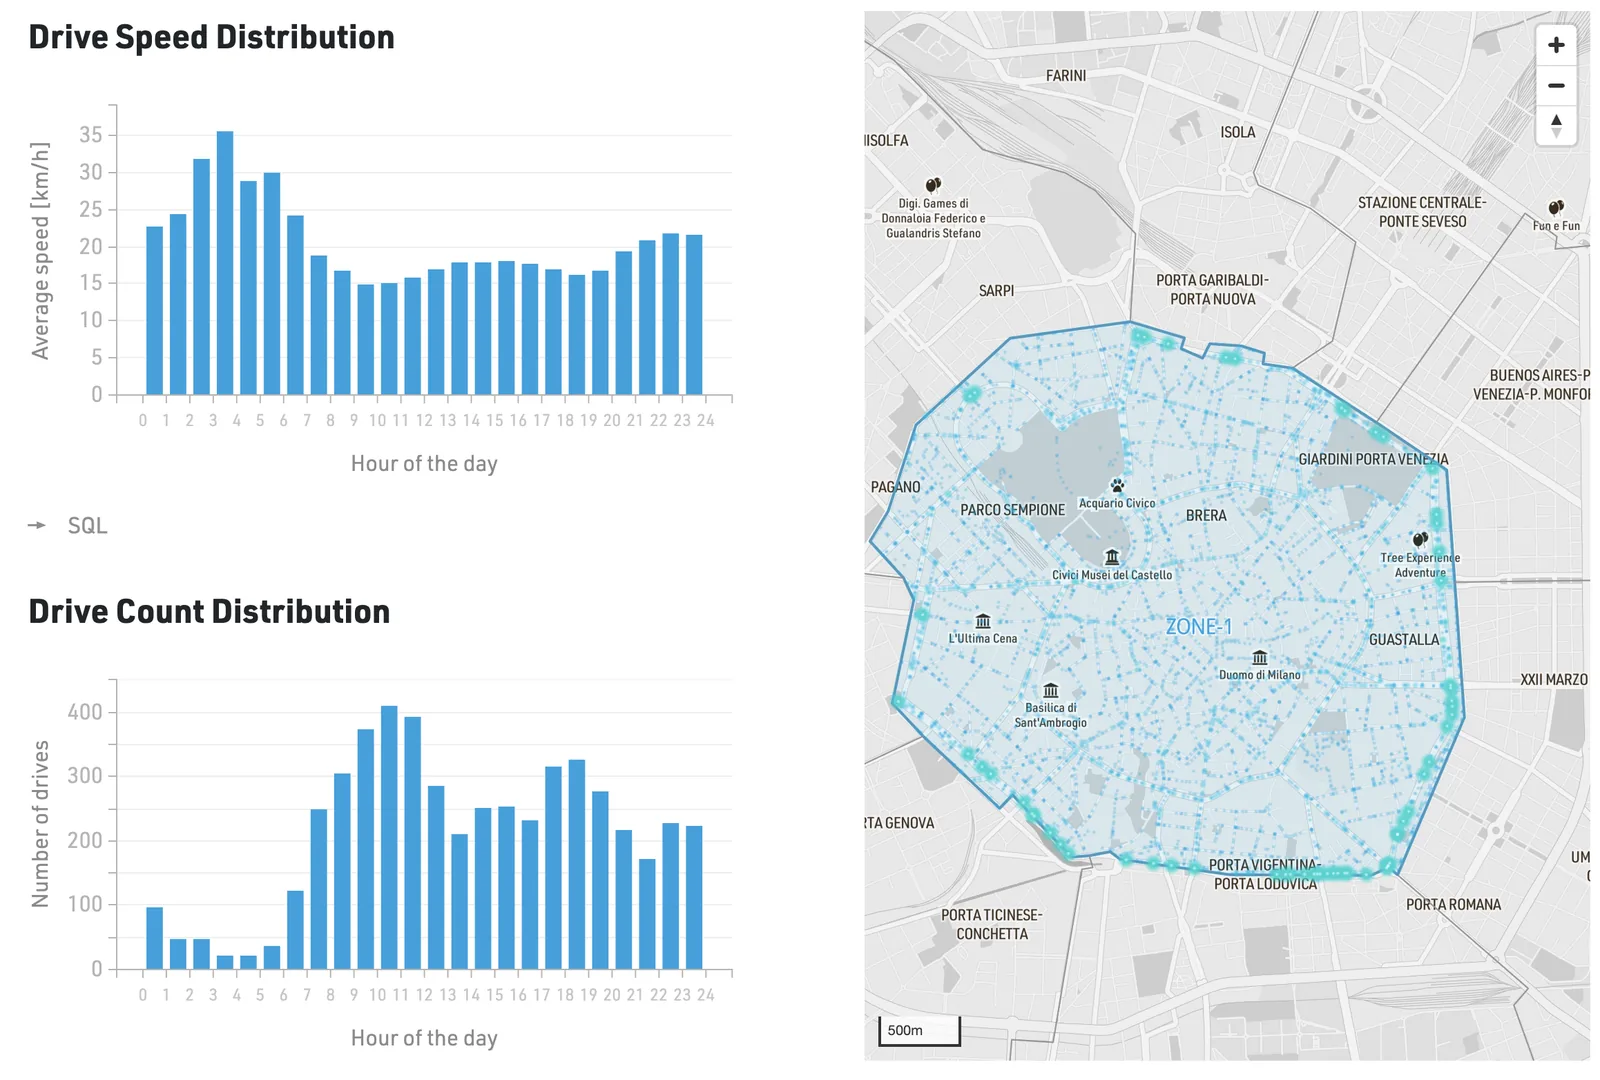
Flows and congestion
Analysis of traffic flows, recurring congestion and anomalies, to understand how the road network moves.
- What we measure
- Number of trips and average speed within an area selected on the map, over a defined period: a day, a week, a month or longer.
- How to read it
- Hourly distributions that highlight traffic peaks and slowdowns, with congestion points shown on the map of the area.
- What it's for
- Traffic plans, managing major events and roadworks.
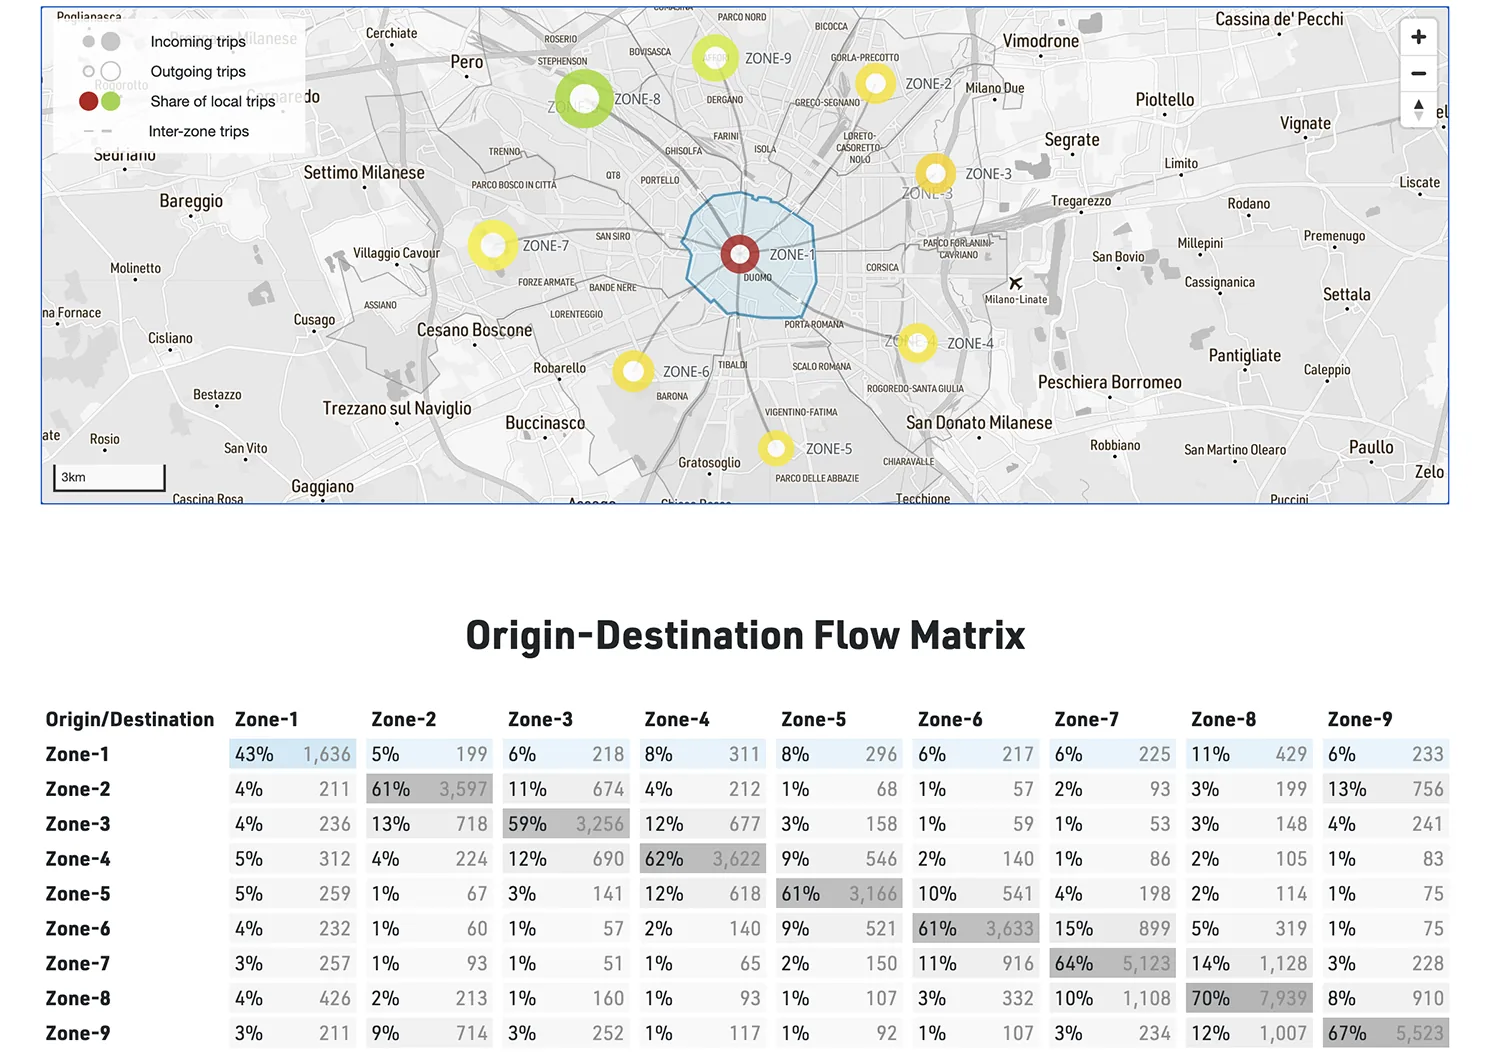
Origin-destination
Journeys between geographical areas, by time of day and period: the real mobility needs of a territory.
- What we measure
- The number of journeys between geographical areas, describing how people travel from one place to another. The analysis reveals daily travel patterns and shows how the different parts of a city or region are connected.
- How to read it
- Zone map and origin-destination matrix, with the number of journeys and their percentage share.
- What it's for
- Drafting and monitoring the SUMP, redesigning public transport routes.
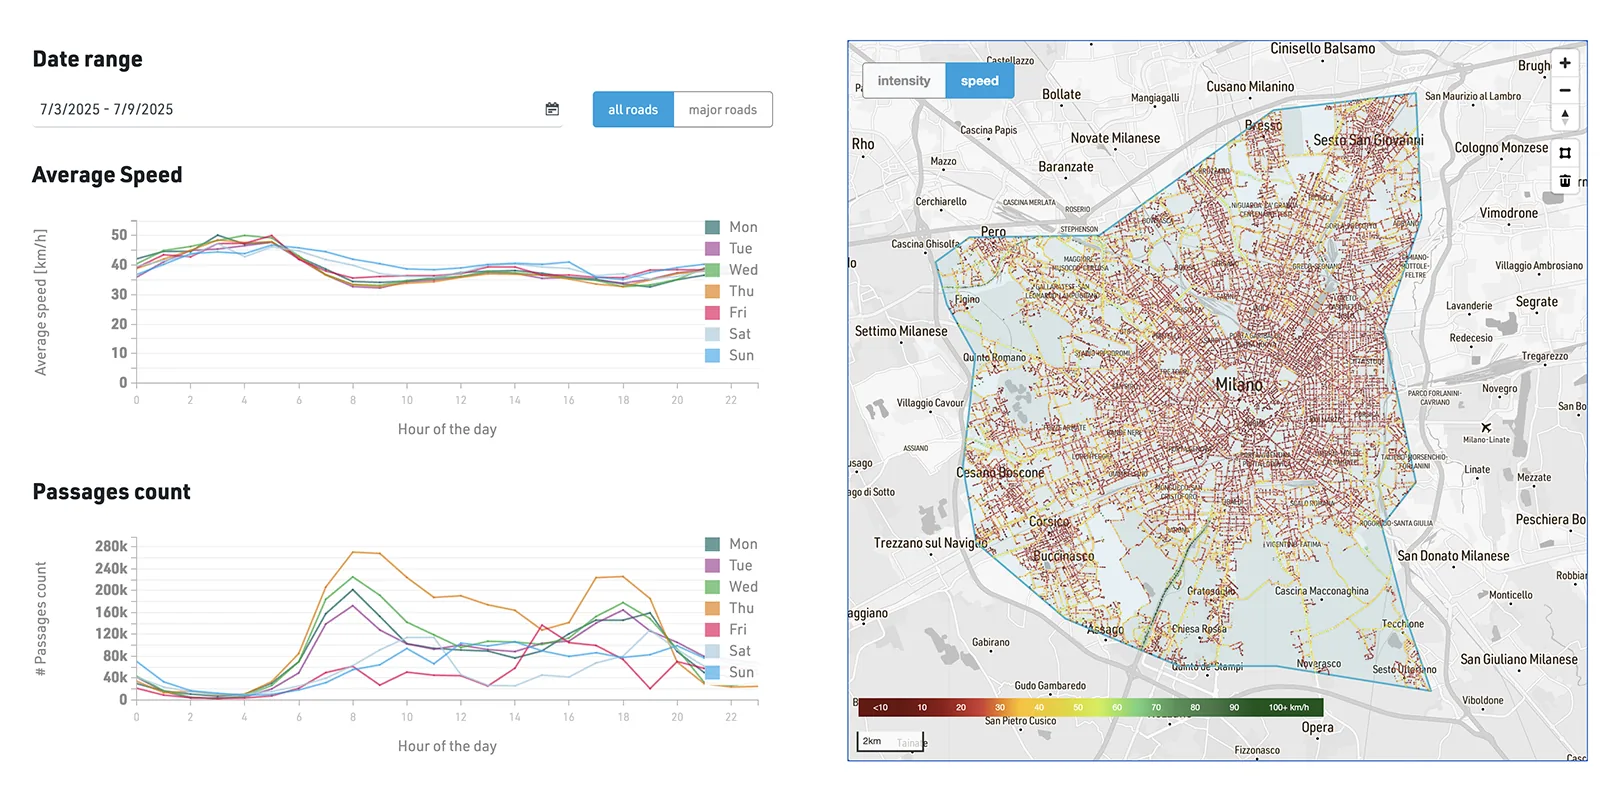
Actual speeds
Average speeds and how they change over time, by individual road segment and time of day.
- What we measure
- Average speeds and vehicle counts by hour and day of the week, across the whole network or on main roads only.
- How to read it
- Hourly curves for each day of the week and a network map coloured by speed, from the slowest to the fastest-flowing segments.
- What it's for
- Identifying the most critical segments and hours, tuning traffic signals and corridors.
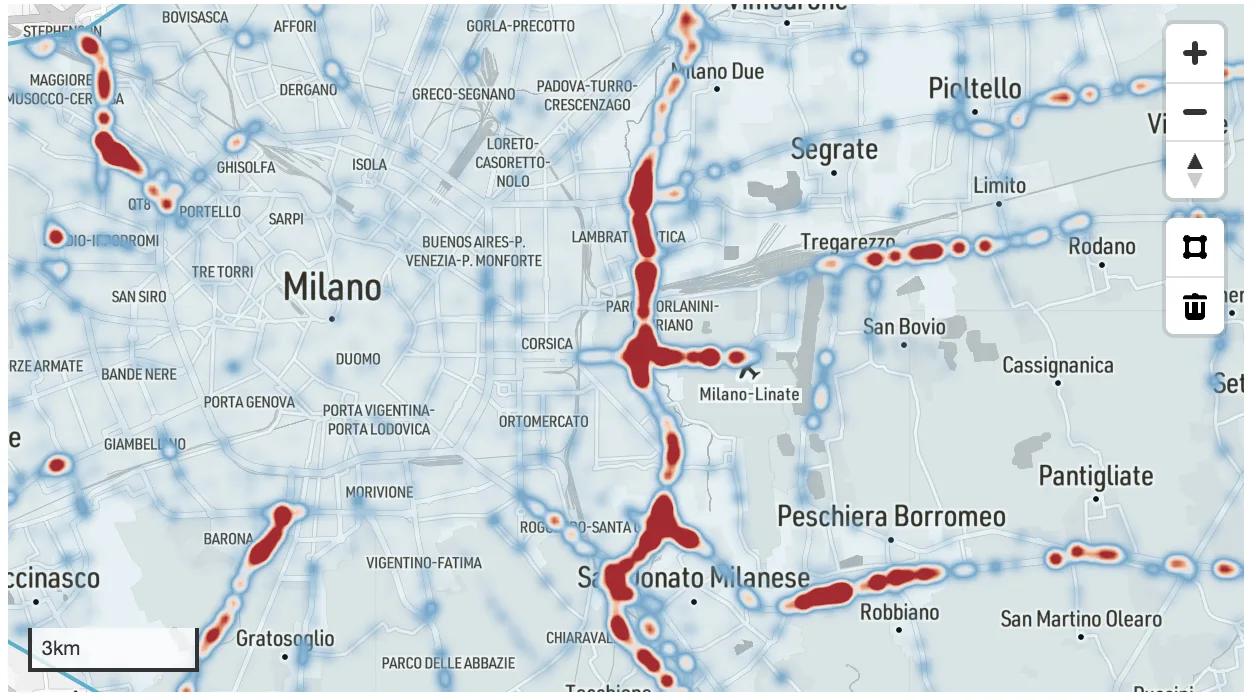
Speeding
Segments where measured speeds exceed the limit, highlighted on the map with increasing intensity.
- What we measure
- Where and how often vehicles exceed the speed limit, segment by segment, over a defined period.
- How to read it
- A heat map of the network: from blue for compliant segments to red for those with the most frequent speeding.
- What it's for
- Planning enforcement and traffic calming where they are really needed, and measuring their effect.
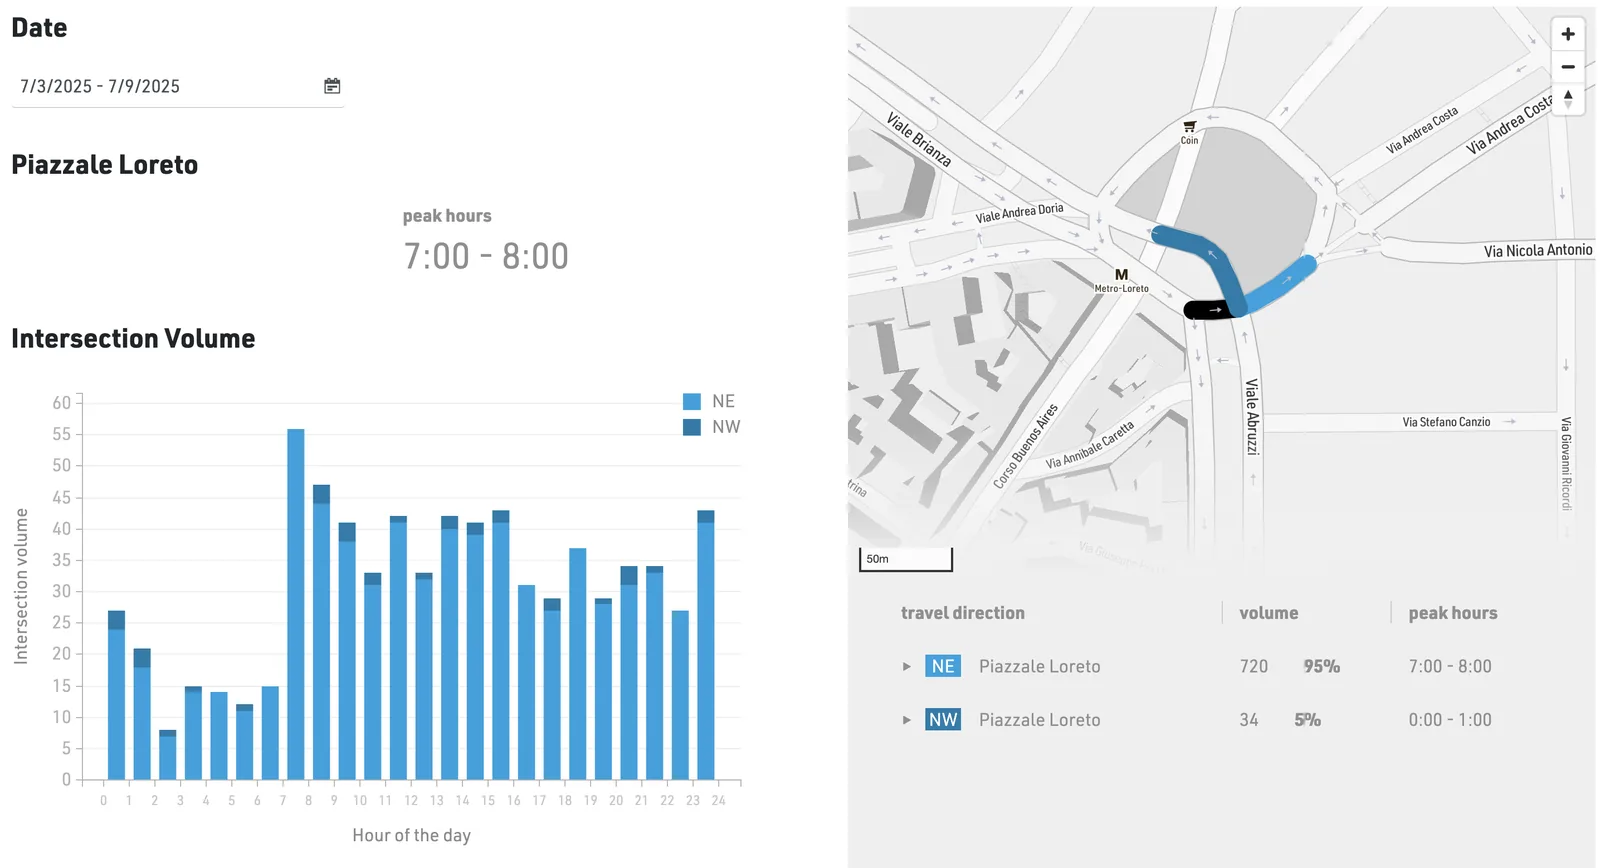
Junction analysis
Traffic volumes and turning movements at a single junction, hour by hour.
- What we measure
- The vehicles passing through a junction for each turning movement, over a defined period.
- How to read it
- Volumes by hour of the day and by direction, with peak hours and the share of each movement on the junction map.
- What it's for
- Tuning traffic signals, assessing changes to the road layout and redesigning the busiest junctions.
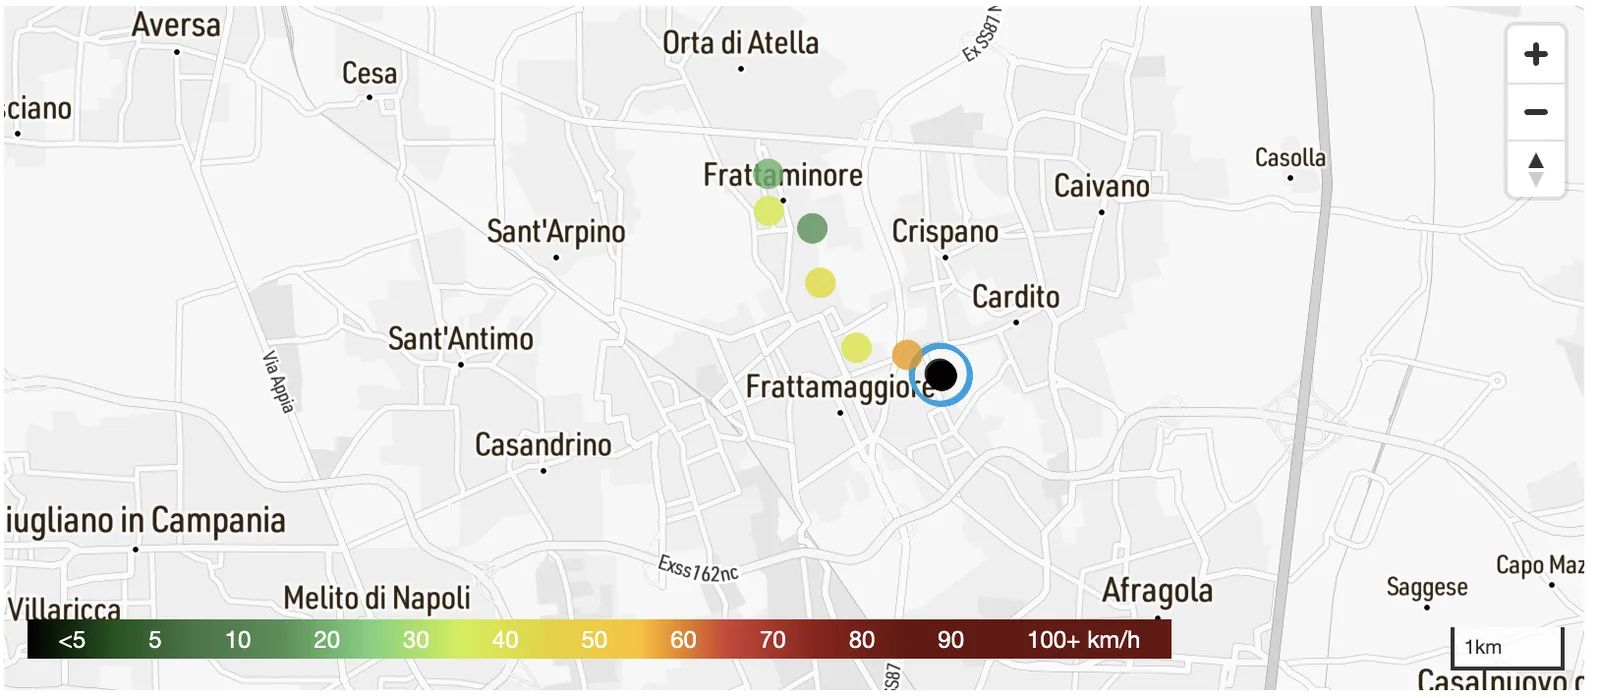
Crashes and dynamics
Crashes detected by connected vehicles, with the vehicle's speed in the moments leading up to them.
- What we measure
- Crashes recorded by connected vehicles and the speed in the moments beforehand.
- How to read it
- On the map, the location of the event and the preceding route, coloured by speed.
- What it's for
- Identifying the most critical segments and understanding how crashes happen, to choose the right interventions.
From ready-made dashboards to self-service reports
Ready-made dashboards
For the use cases already available: choose the area and period, and the results are ready to explore.
Tailored analysis
For specific needs, we build new analyses and dashboards around the questions of your project.
Self-service reports
With our query engine you create the reports you need yourself, for any area, period or subset of data.
API integration
Data and indicators flow straight into your platforms, models and dashboards.